OTLP is the standard delivery protocol for OpenTelemetry (OTel). It dictates exactly how metrics, traces, and logs should be packaged and transmitted over the network.
Dynamic monitoring configuration
The runtime configuration interface lets you manage monitoring connections on-the-fly.
Accessing the configuration interface
Go to Administration → Monitoring:
.png)
Adding a monitoring platform
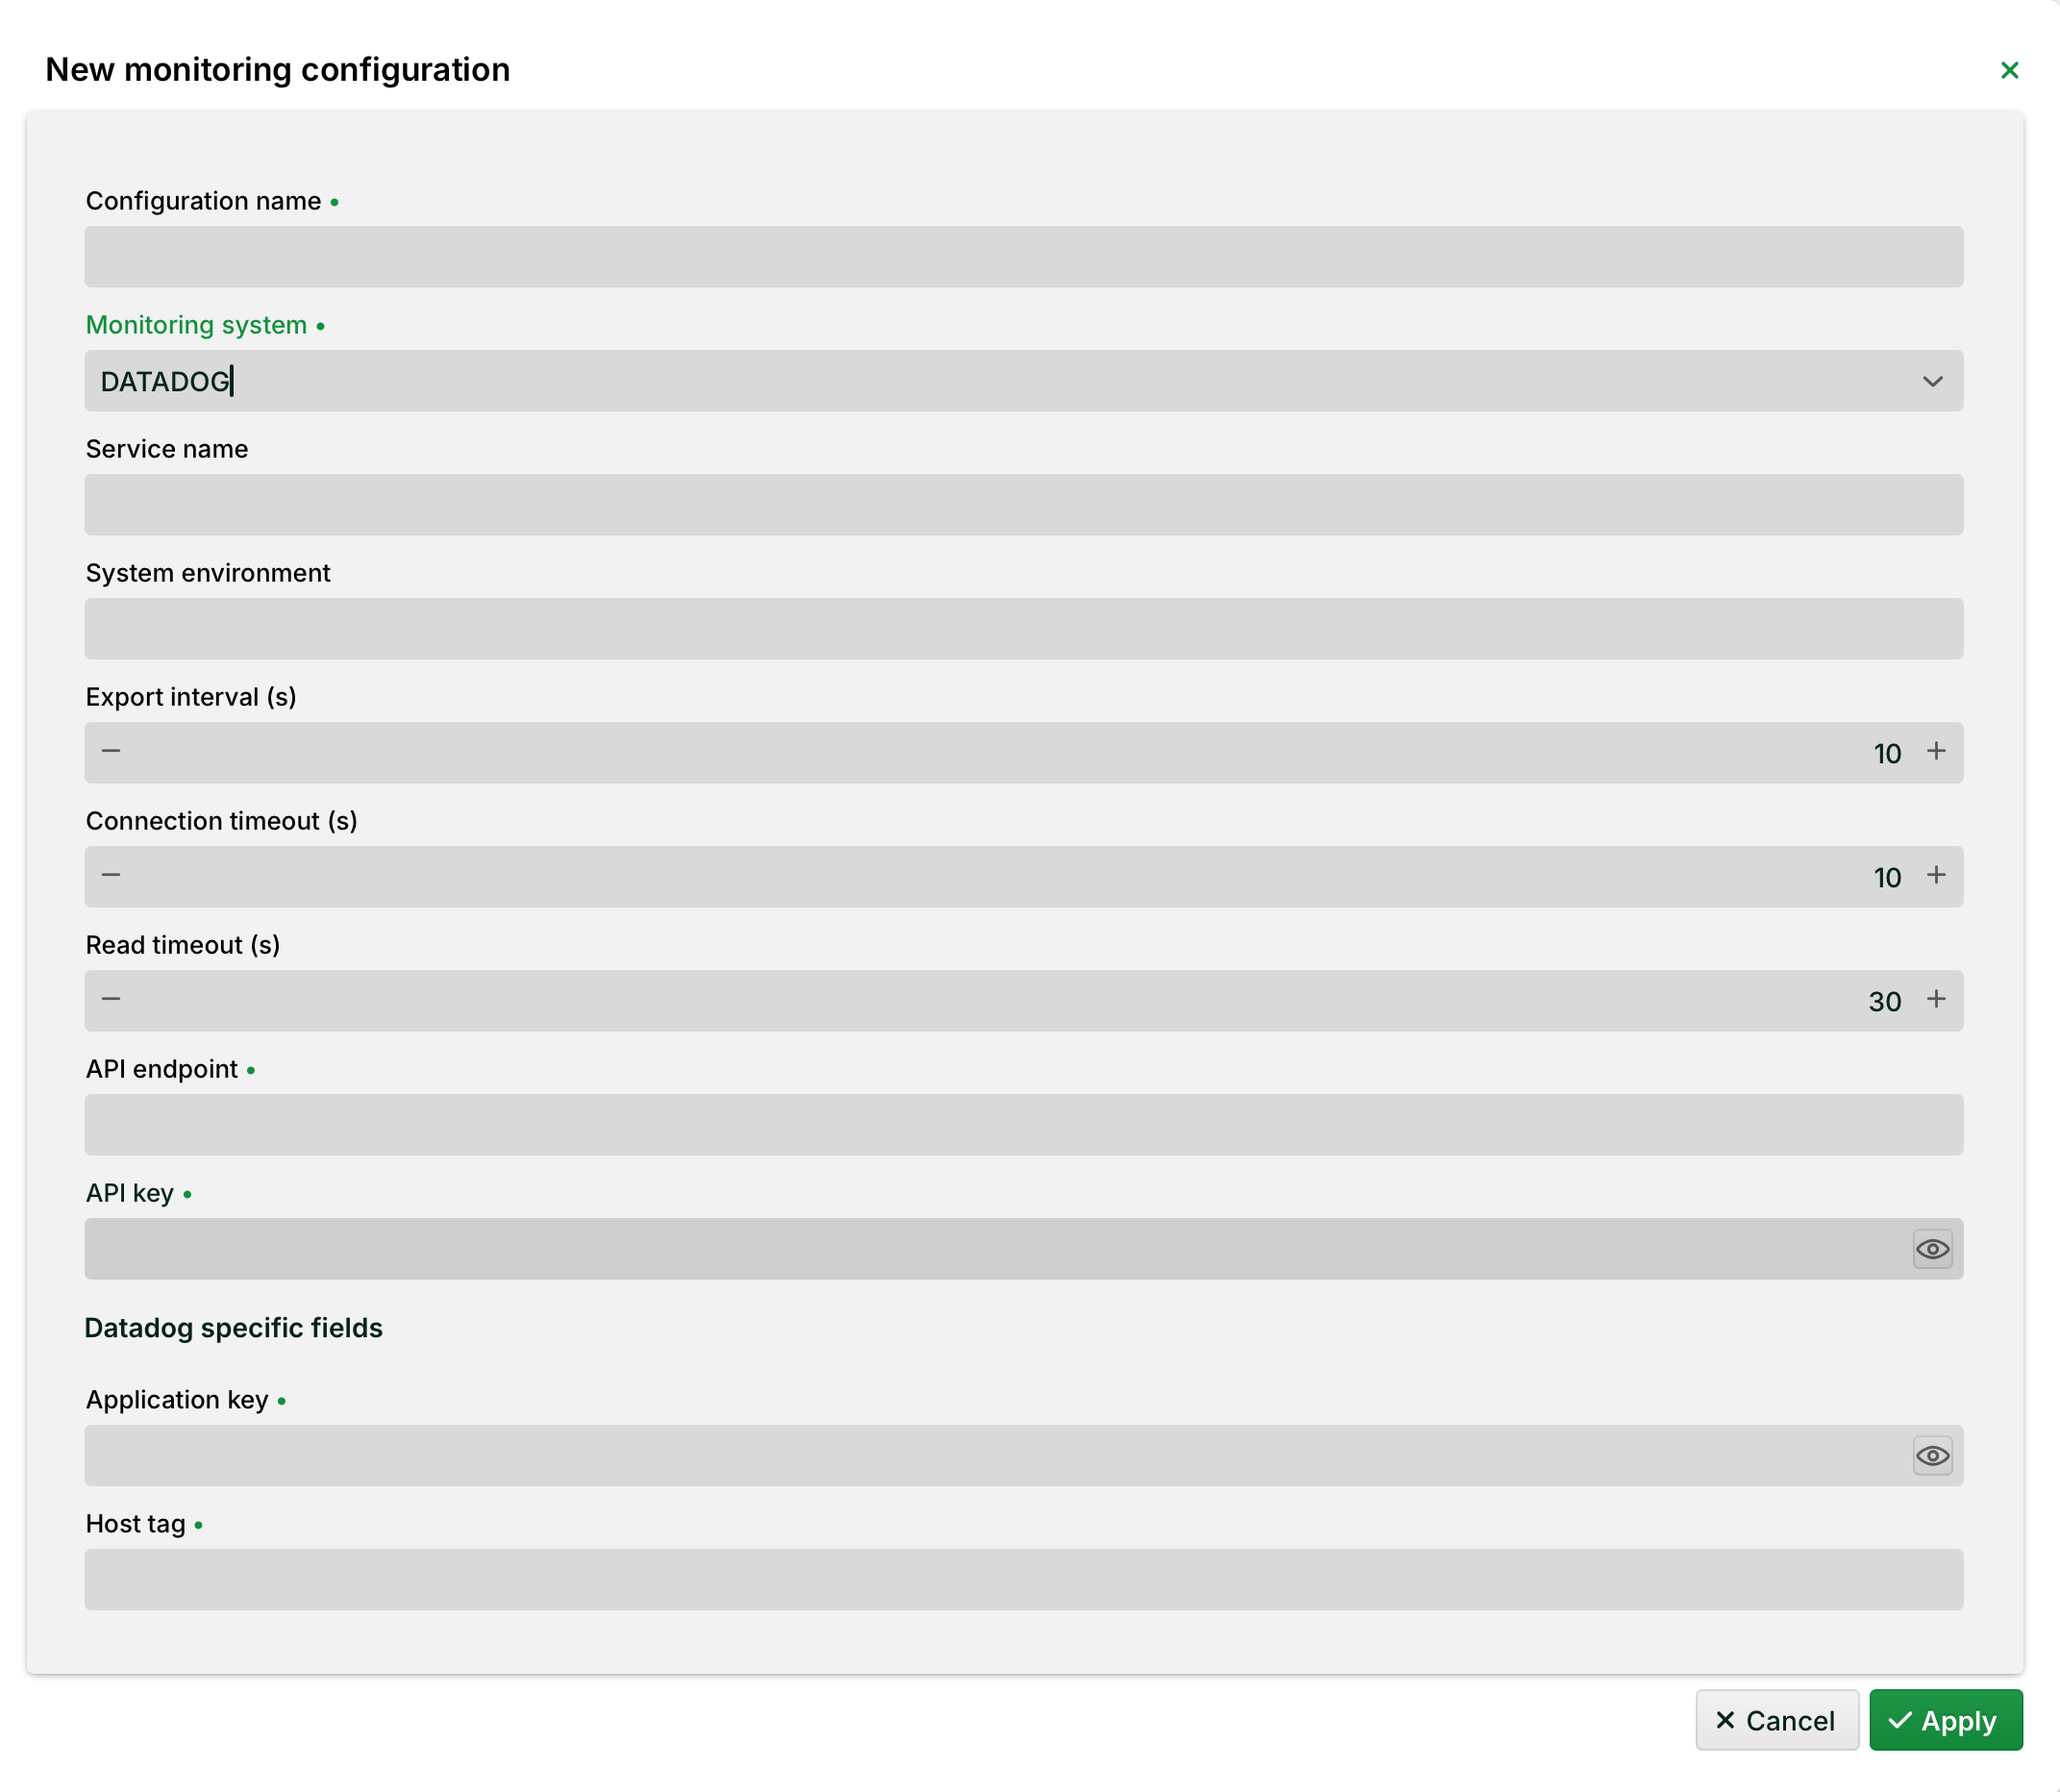
Click the plus icon in the bottom-right corner and complete the configuration form with your monitoring platform details:
General fields
Configuration name (required): Unique name for the configuration.
Monitoring system (required): Target platform. Available options:
OTLP,DATADOG,PROMETHEUS.Service name/System environment: Optional labels used for filtering and dashboards on the target platform.
Export interval, Connection timeout, Read timeout: Time values in seconds (s). Defaults: 10 s/10 s/30 s.
API endpoint (required): URL of the target platform's metrics endpoint.
API key (required): Authentication token for the API endpoint.
Platform-specific fields
Depending on the selected Monitoring system, additional fields are displayed:
DATADOG: Application key (required) and Host tag (required).
PROMETHEUS: Prometheus token – generated automatically when the configuration is created.
WARNING: The Prometheus token is only visible during creation. Copy it immediately and store it in a secure location – it cannot be retrieved later.
Click Apply to activate the new monitoring configuration. Metrics will begin flowing to your monitoring platform within seconds.
Managing configurations
Add/Edit: Modify any configuration and save. The connection restarts automatically with the new settings.
Delete: Remove a configuration to stop exporting to that platform.
NOTE: All changes take effect immediately without requiring an application restart or affecting other active configurations.
Platform-specific setup examples
The following examples show how to populate the configuration form for popular monitoring platforms.
Service name and System environment are free-text labels you choose. They appear as filter attributes in your dashboards and are not validated by LDP. There is no fixed required value; pick something meaningful for your installation.
Grafana Cloud (OTLP)
When you set up an OTLP data source in Grafana Cloud, you receive three pieces of information: an endpoint URL, a numeric Instance ID, and a token. The Instance ID is not entered as a separate field in Lobster, the authentication is handled entirely through the API key field.
NOTE: Recommended: use a Grafana Cloud Access Policy Token. In your Grafana Cloud portal, go to Home → Administration → Access Policies, create a new policy with the metrics:write scope, and generate a token. This token is used directly as the API key and removes the need to handle the Instance ID separately.
Lobster field | Value |
|---|---|
Monitoring system |
|
API endpoint | Find your exact URL in Grafana Cloud under Connections → Add new connection → OpenTelemetry. |
API key | Your Grafana Cloud Access Policy Token (recommended). |
Service name | A label identifying this Lobster installation, e.g., |
System environment | A label for the deployment stage, e.g., |
Export interval |
|
Connection timeout |
|
Read timeout |
|
New Relic (OTLP)
New Relic accepts metrics via a standard OTLP endpoint. Use your New Relic License key (Ingest – License type) as the API key. No Instance ID or additional credential encoding is required.
Lobster field | Value |
|---|---|
Monitoring system |
|
API endpoint | EU region: |
API key | Your New Relic License key (found under Account settings → API Keys, type: Ingest – License). |
Service name | E.g. |
System environment | E.g. |
Export interval |
|
Connection timeout |
|
Read timeout |
|