This article is the reference for the cluster restart of the Lobster Data Platform. It covers prerequisites, REST endpoints, status values, and troubleshooting. For step-by-step instructions, see Restarting the cluster.
Click path
Navigate to Administration > Base settings > System, DMZ, Loadbalancing.
Prerequisites
The Forced restart … button appears only if the platform already runs within the Lobster Application Wrapper. If the platform runs as a direct Java process, the function stays disabled. Instead, this message appears: "Restart is disabled because not all elements run within the Lobster Application Wrapper."
Prerequisite | Details |
|---|---|
Lobster Data Platform | Release ≥ 26.2 |
Application Wrapper | All instances (NC, WNs, DMZs) must run within the Application Wrapper. |
Permissions | Administrator role |
Authentication | Authenticated session. For details, see OAuth2 for API access. |
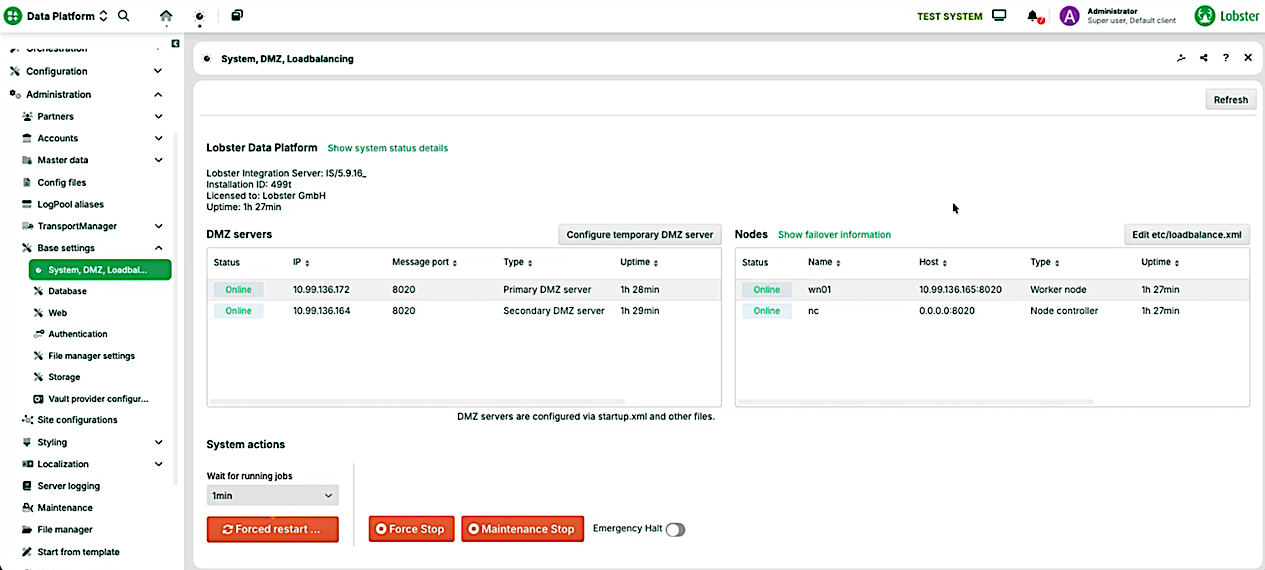
Lobster Data Platform interface showing DMZ server status and system actions options.
DMZ server and Nodes table
The page shows two tables: the DMZ server table and the Nodes table. Both tables contain the Version and Downloaded updates columns. Compare these columns before a restart. This way, you make sure that all cluster elements run the same version. For the complete column reference, see Load balancing in the Control Center.
System status details
Click the Show system status details link to open a movable modal dialog. The dialog shows detailed information.
The System status details dialog shows a snapshot of the system state. The dialog summarizes the status of the communication services, the database connections, and the active basic settings. Click Ok to close the dialog.
Service status
The first section lists the communication services of the server. The server name appears at the beginning of the section, for example local. Checked services: FTP, FTPS, SMTP, OFTP, OFTPS, SSH, MESSAGE, DATABASE, SAP. The dialog shows two lines per service.
<SERVICE>_TLS: Indicates whether TLS is enabled for the service (trueorfalse).<SERVICE>: Shows the status and the used port. Possible values:ok (port <number>),failed,untested.
NOTE: If a service reports the status failed, an additional line <SERVICE>_FAILURE shows the related Java exception. Parts of the error message can be Base64-encoded.
DB
This section lists all configured database aliases. For each alias, you see the number of open connections (total open connections).
SAP
This section lists the configured SAP aliases.
Crashed Jobs
This section lists crashed jobs, if any exist.
Basic settings
This section shows the active basic settings of the system as a read-only view. The list supports diagnostics. You change the values elsewhere, for example in the base settings.
Important values for diagnostics:
MessageService counters: messages on hold, received, and sent.
License limits for workflows and ETL/ELT and their current usage.
DMZ configuration: ports for FTP, SFTP, and the message service, and the maximum number of allowed DMZ servers.
Load balancing: status, load factor usage, and failover.
Backup and retention: backup directory and retention periods for logs, backups, and statistics.
Error mails: status, recipients, and sender for error notifications.
Disk space: limit for free disk space and behavior when the limit is reached (
Shutdown on low disk space).
TIP Use the dialog for a quick diagnosis. For example, check whether all services run and whether the ports are configured correctly.
Show failover information
Open the Nodes tab. Click the Show failover information link to open a movable modal dialog. The dialog shows detailed information.
REST API
Endpoints
Method | Endpoint | Description |
|---|---|---|
|
| Triggers a cluster restart. |
|
| Returns the status of a running restart. |
|
| Returns the current cluster health. |
Authentication
All endpoints require an authenticated session. Required headers:
X-ENV-SessionToken: Active session token.X-ENV-ClientId: ID of the client endpoint.
For setup details, see OAuth2 for API access.
POST /system/restart
Request body:
Field | Type | Required | Description |
|---|---|---|---|
| String | Yes | Readable reason for the restart. |
| Number | Yes | Grace period in minutes. Must be positive. Default: 1. |
| Boolean | Yes | Currently has no effect. Even with |
Success response: 202 Accepted
{
  "status": "SCHEDULED",
  "isUpdatingPlatform": false,
  "version": "26.2.0"
}
Error responses:
Code | Meaning | Body |
|---|---|---|
| Invalid request, for example |
|
| Authentication is missing or expired. | Error code |
| User without administrator permission. |
|
| Another restart is already running. |
|
| The restart could not be scheduled. |
|
| The prerequisite "all instances in the Application Wrapper" is not met. |
|
GET /system/restart
Response during a running restart: 200 OK
{
  "status": "RUNNING",
  "isUpdatingPlatform": false,
  "version": "26.2.0"
}
Response when no restart is running: 204 No Content. No body. Response on error: 500 Internal Server Error with {"message": "Restart failed unexpectedly"}.
Status enum values
Value | Meaning |
|---|---|
| The restart was scheduled. Response to a successful |
| The restart is running. |
| The restart is in its final phase, for example shortly before the Node Controller restarts. |
| The restart completed successfully. |
| The restart failed. |
GET /system/health
Returns the current cluster health. The endpoint is independent of the restart flow. You can call it at any time.
Response: 200 OK
{
  "clusterHealth": {
    "nodes": [
      {
        "gatewayServer": false,
        "startTime": "",
        "status": "DOWN",
        "type": "PRIMARY_DMZ",
        "uri": "http://10.99.136.173:8020"
      },
      {
        "gatewayServer": false,
        "startTime": "2026-04-21T12:04:00.150Z",
        "status": "UP",
        "type": "SECONDARY_DMZ",
        "uri": "http://10.99.136.187:8020"
      },
      {
        "gatewayServer": false,
        "startTime": "2026-04-21T12:05:12.494Z",
        "status": "UP",
        "type": "WORKING_NODE",
        "uri": "http://10.99.136.174:8020"
      }
    ]
  },
  "overall": {
    "startTime": "2026-04-21T12:05:59.632Z",
    "status": "UP",
    "version": "26.2.0"
  }
}
Response fields per node (nodes[]):
Field | Description |
|---|---|
| Indicates whether the DMZ node is a gateway server. |
| Start time of the node. Empty if the node is down. |
| Node status: |
| Node type: |
| URI of the node. |
Response fields overall:
Field | Description |
|---|---|
| Start time of the Node Controller. |
| Overall status of the cluster: |
| Current platform version. |
Polling and logging
During the restart, the Node Controller polls the status of the restarted components. Polling interval: 5 seconds. Polling window: 3 minutes. If a component does not reach the UP status within the window, the restart is canceled.
Every step is logged:
Sysout log with timestamp, node identity (host and port), and status.
Database table for later analysis.
Limitations
Only one restart is possible at a time.
No restart of single nodes. The entire cluster always restarts.
A pending platform update is not installed by the restart.
After the grace period expires, the restart is forced, even if jobs are still running.
Troubleshooting and FAQ
Troubleshooting matrix
Symptom | Likely cause | Next steps |
|---|---|---|
Forced restart … button is disabled. | The Application Wrapper is not active, a restart is already running, or the update status is inconsistent. | Check the Application Wrapper status. Compare the Version and Downloaded updates columns in the DMZ server and Nodes table. See Load balancing in the Control Center. |
Restart hangs in the DMZ step. | DMZ is not reachable or a long-running protocol drain. | Check the DMZ logs and the network. Increase the grace period or repeat the restart at lower load. |
Health shows | Faulty | Check the values in |
Frequently asked questions
Who can trigger a cluster restart?
Only administrators in Administration > Base settings > System, DMZ, Loadbalancing or with an admin token via the API.
Are running jobs stopped?
Running jobs get a grace period. After that, the system stops jobs that are still running.
Does the function work on on-premises installations?
Yes, as long as all on-premises instances run within the Application Wrapper.
What happens in HA environments?
The components start in a controlled order to minimize downtime. Short unavailability can occur.
Why is the button disabled?
Possible reasons: The Application Wrapper is inactive, another restart is already running, or the update status between platform and DMZ is inconsistent.