The Process map is an automatically generated visualization. It shows a network of connected data processing modules. These include, for example, profiles, CI entries, ASM entries, ETL/ELT pipelines, databases, portals, and REST APIs.
The edges between the nodes represent the relationships defined in the configuration. This lets you recognize process flows and data flows at a glance.
The Process map mainly supports you with three tasks:
Overview: You get a quick overview of process flows and data flows.
Error analysis: You see errors from the last execution of the modules involved.
Navigation: You open the configuration of a node by double-clicking it.
Possible entry points include profiles, ETL/ELT pipelines, ASM, CI, channels, APIs (REST/MCP), event handlings, client workflows, ribbon macros, portals, and input forms.
Where to find the "Process map"
A Process map is always opened from a relevant context, so that specific content is already available for display when it opens.
By default, the "Process map" appears in its own view slot and shows the process network for the configuration in the calling context.
Working with the "Process map"
The "Process map" opens in its own view. There you see the nodes and their connections as a network. TIP Click a preview to enlarge a screenshot.
The screenshot on the right shows two view slots arranged vertically, one above the other (see View menu). It demonstrates the "Process map" as an aid when working with configurations. The example uses an event handling for this purpose. The upper view slot shows an overview for Event handling, in which one entry ("XF_EXPORT_INCIDENT") is selected. In the ribbon (subcategory Details), the Button Open as Process map has just been clicked. This interaction opens the detail view of the "Process map" in the lower view slot, to visualize the process network around the selected event handling. The keyword "EXPORT" in the name of the event handling already hints at a profile call (see Export) with the data of an entity (of the In a very compact form, the associated "Process map" provides a quick overview that places the event handling within a broader process context:
|
|
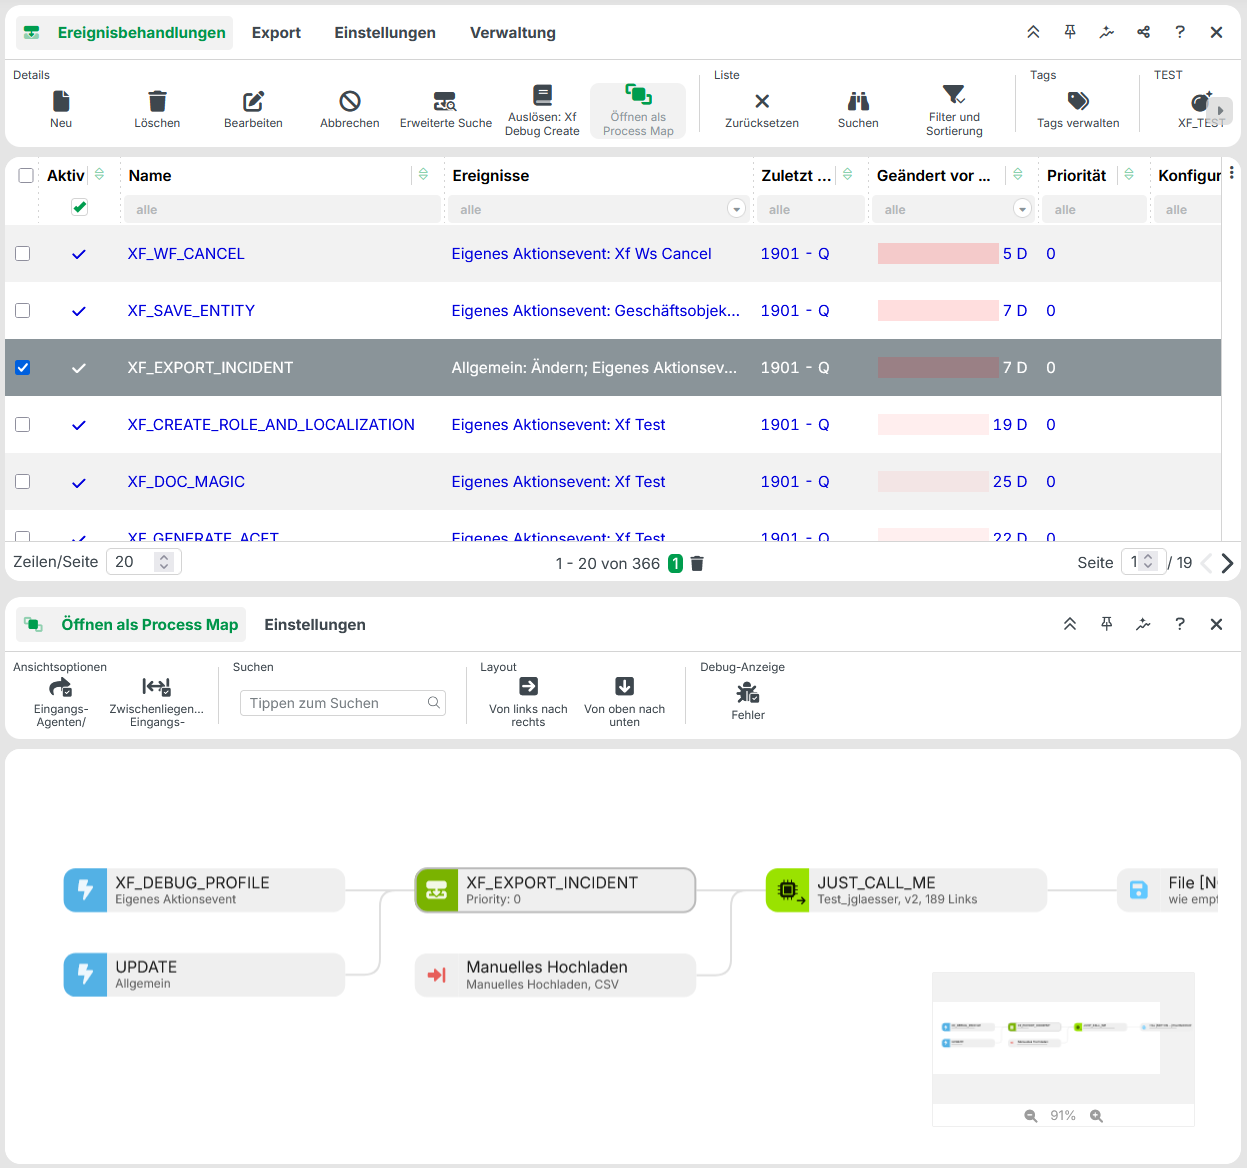
You move the visible section in the "Process map" view by drag and drop. You can zoom in interactively. This makes even larger process networks easy to handle. At the bottom right of the detail area you see a schematic with a zoom bar. It shows the current visible section (white) relative to the overall diagram (gray). In the example, the response route (File) is only partially visible. It represents the end of the process.
NOTE:
In the example, the "Process map" was opened from a single selection in the overview. This is also possible with a multiple selection. In that case, the opened "Process map" does not necessarily contain a single connected process network. It can also contain several non-overlapping networks. The "Process map" arranges these next to or above one another on the canvas. This can be useful, for example, in combination with the Search ribbon function.
If you change the selection in the overview for Event handling, the associated process network does not appear automatically in the already open "Process map" view. Clicking Open as Process map again does not refresh the open view either. Instead, the "Process map" opens an additional view. If only the two view slots shown are configured in the Main window for views, every additional "Process map" instance appears in the lower view slot.
The procedure for opening a "Process map" differs depending on the context. The information shown also varies depending on the configuration. The following table documents the details.
Context | Display in the "Process map" | Details |
|---|---|---|
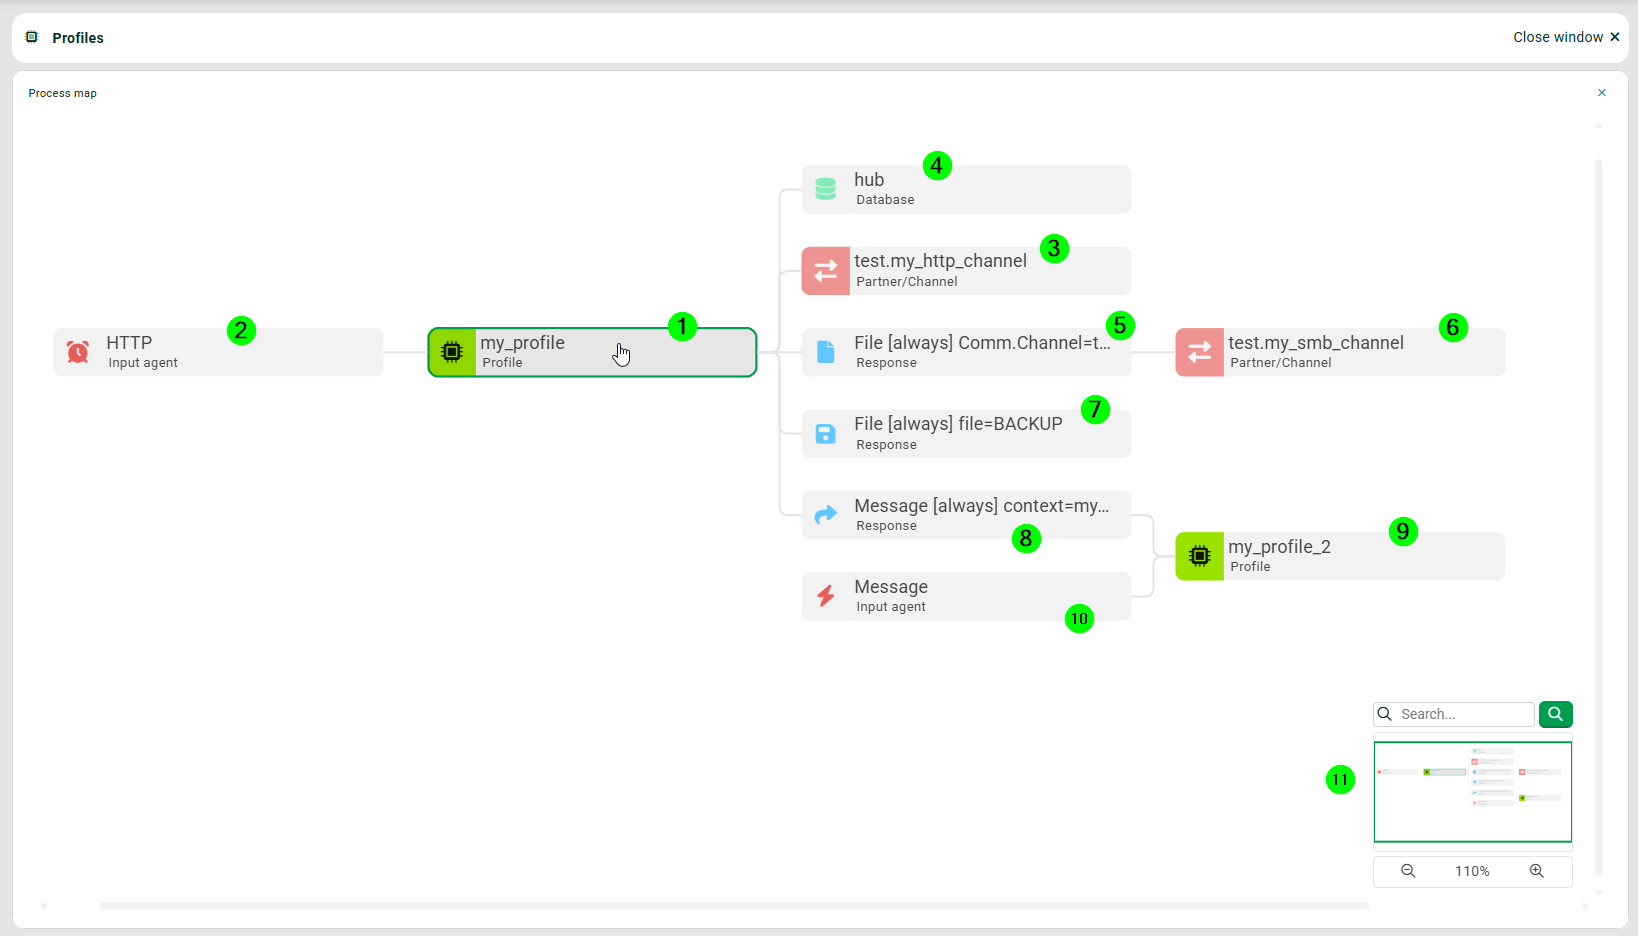
To open a "Process map" for a single profile:
NOTE: You can also select an entire group to open a "Process map" for all profiles in that group. | ||
| The numbers in parentheses correspond to those in the screenshot. TIP Click screenshots to enlarge them. (2) The input agent of profile (1). (3) A channel that profile (1) uses in its input agent (2). (4) A connected database that is used in phase 4 of profile (1). (5) A response route of the File type that is used in profile (1). (6) A channel that is used in the response (5). (7) Another response route of profile (1) that creates a backup file. (8) Another response route of the Message type that calls a second profile. (9) A second profile that is called by profile (1). (10) The input agent of type Message of the second profile. (11) A navigation area in which you can move the "Process map", search for specific entries, and change the display size. | |
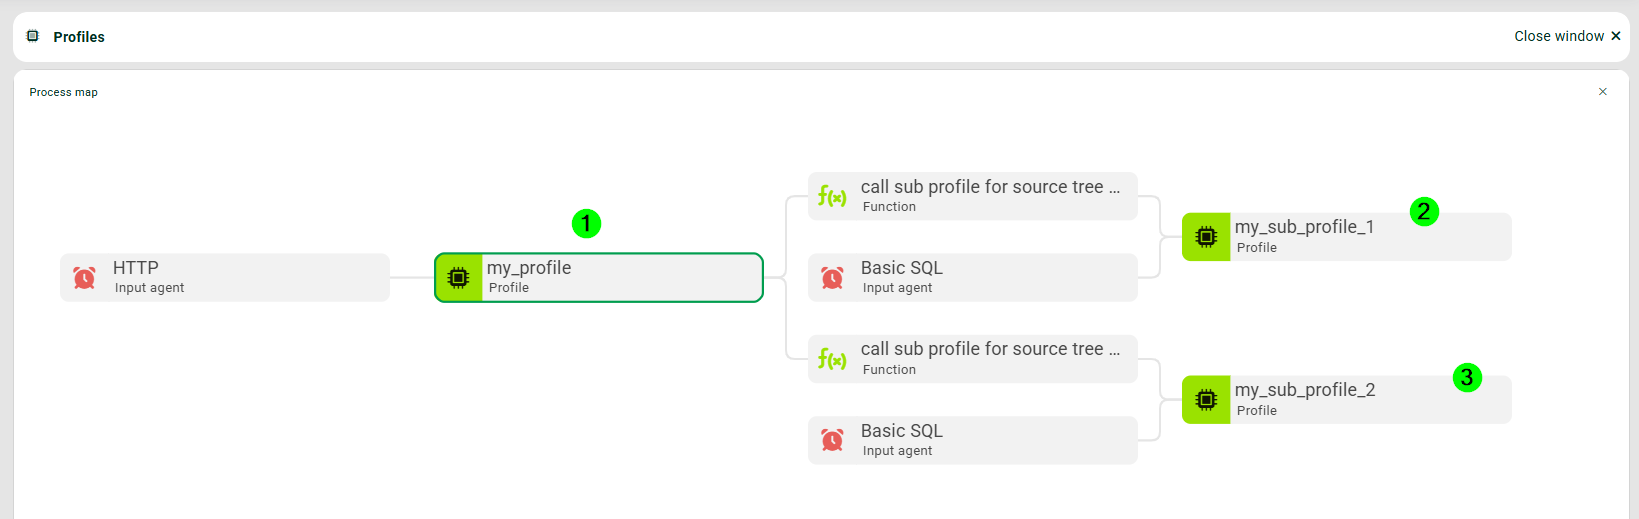
└ Sub-profiles |
| (1) The profile for which you opened the "Process map". (2) First sub-profile that is called by profile (1). (3) Second sub-profile that is called by profile (1). |
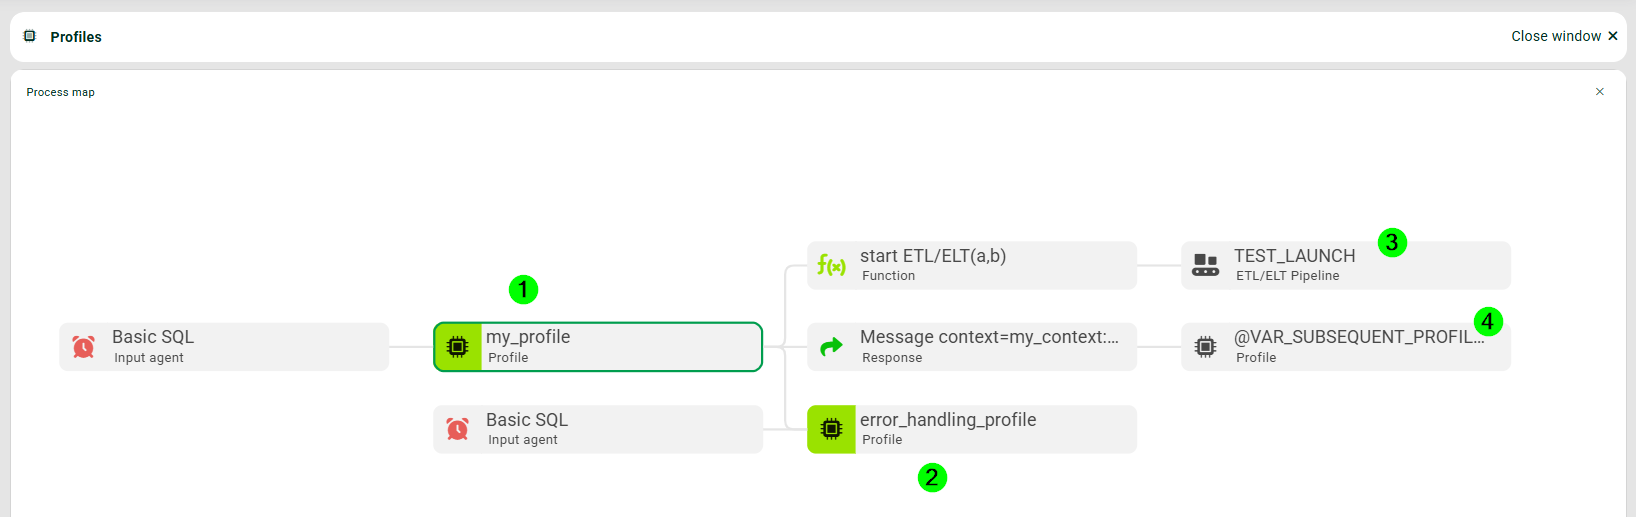
ETL/ELT |
| (1) The profile for which you opened the "Process map". (2) Profile that is called if an error occurs in phase 1 of profile (1). (3) Profile (1) calls an ETL/ELT entry with a function. (4) Via a message, the profile calls a subsequent profile, with the name of the profile specified by a variable. |
CI & ASM |
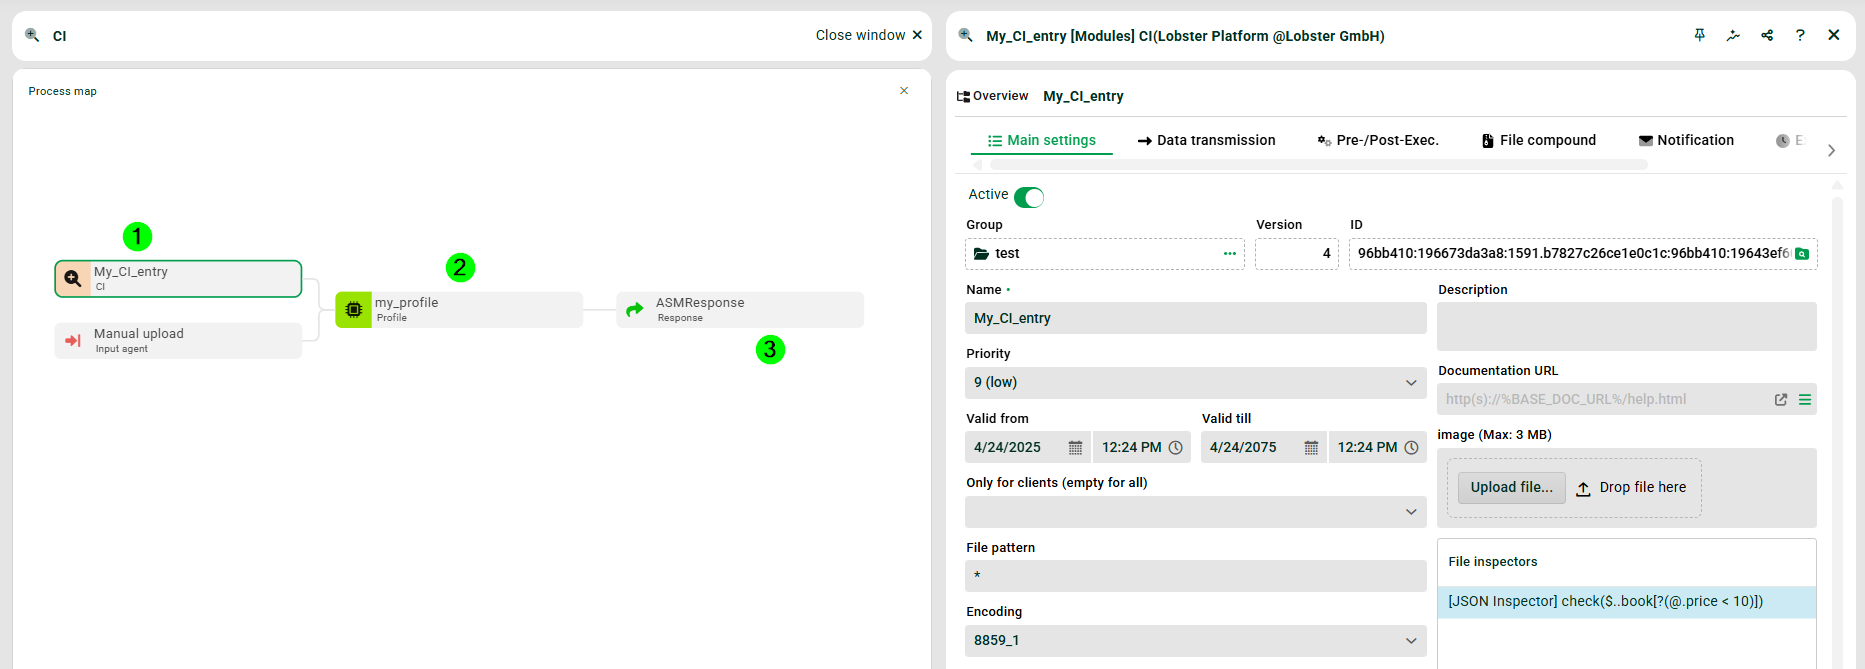
| (1) A Content inspection entry sends files to profile (2), which sends the files to an ASM entry (3). |
(1) A channel that uses a connected profile in its input agent or response. | In the channel overview under Manage Partners > Channels, you can open the "Process map" directly from a channel’s context menu. To do so, select the entry Open Process map. The channel node displays information about the channel’s certificate. This includes the status of the certificate. | |
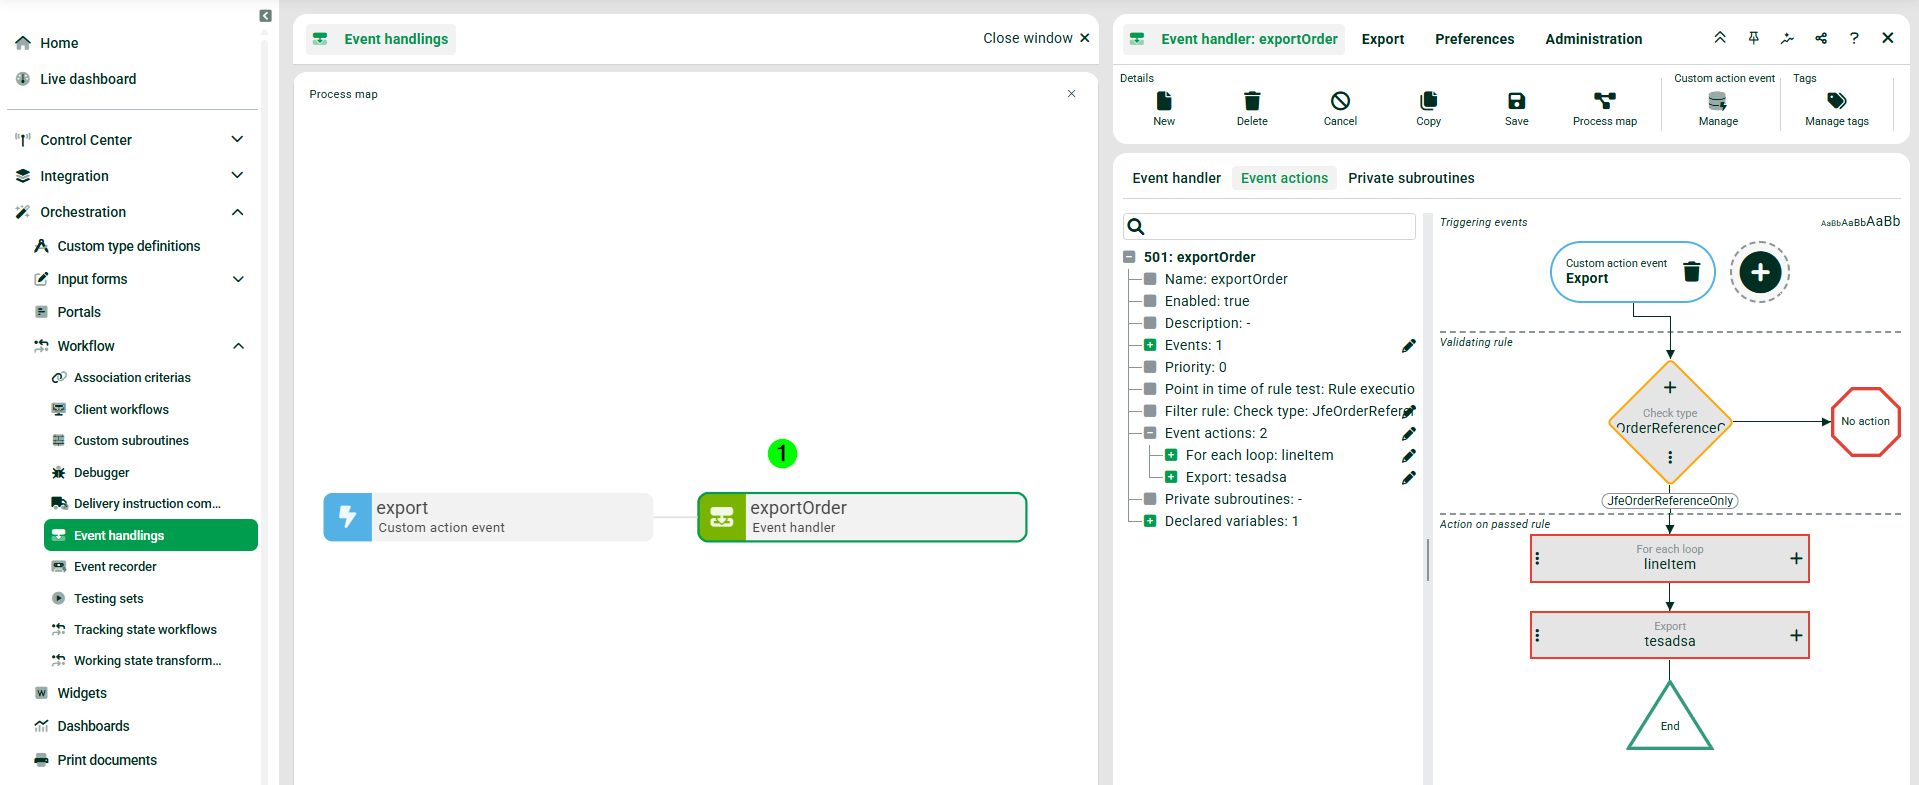
| (1) An event handling for which the "Process map" was opened directly under Orchestration > Workflow > Event handlings. | |
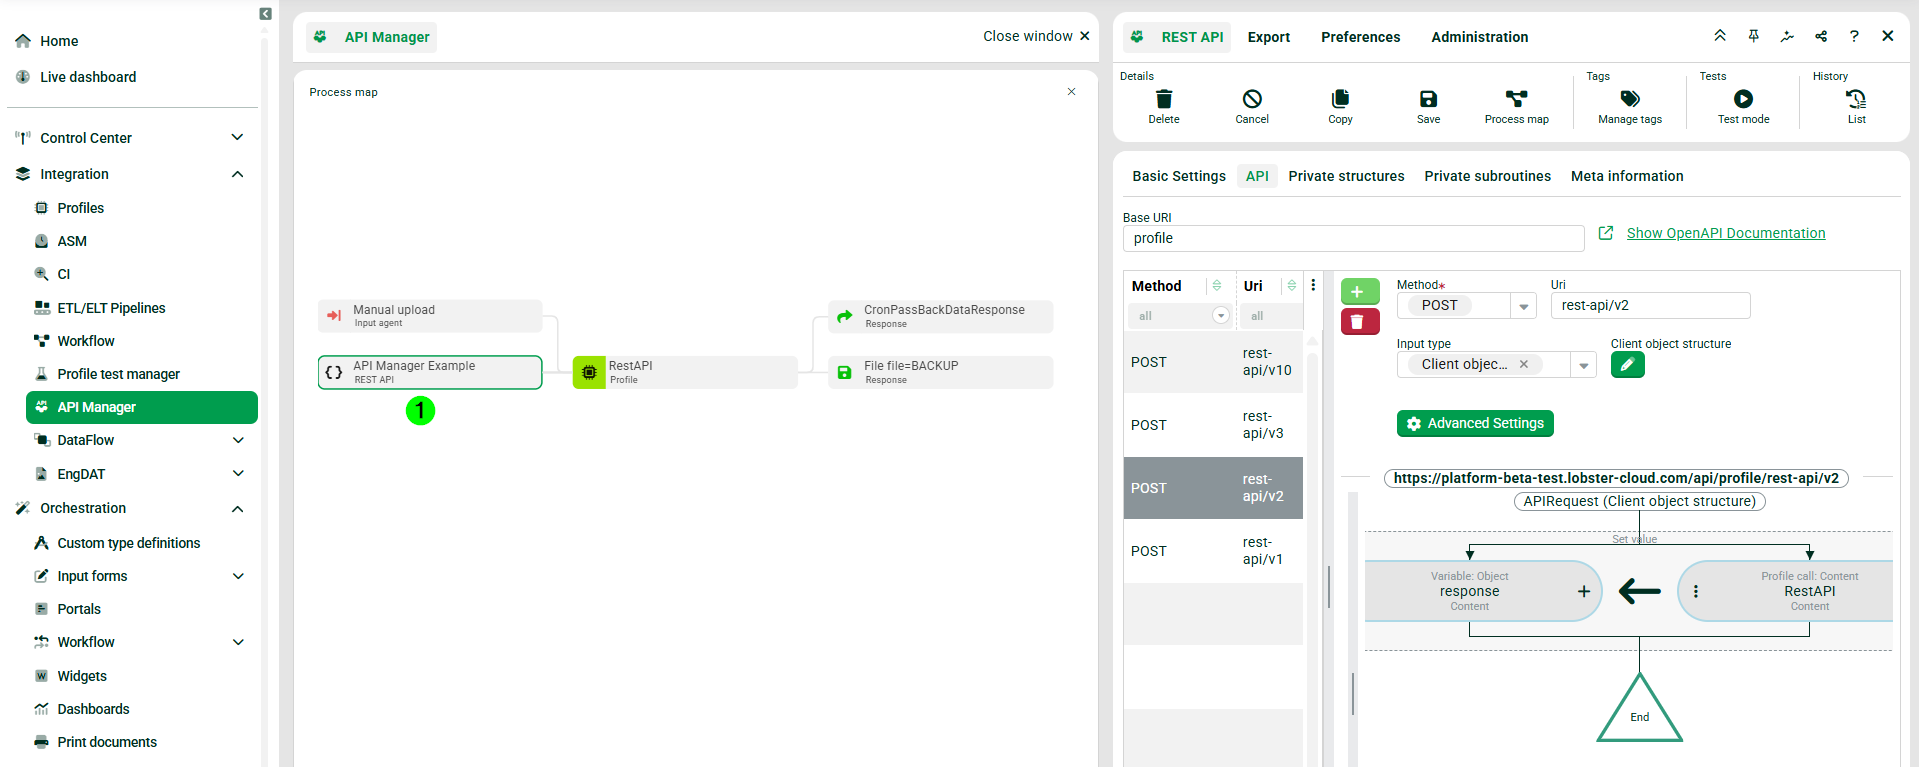
| (1) A REST API for which the "Process map" was opened directly under Integration > API Manager. MCP nodes and REST API nodes are shown in a dedicated color. This color coding lets you identify these node types in the "Process map" at a glance. | |
| ||
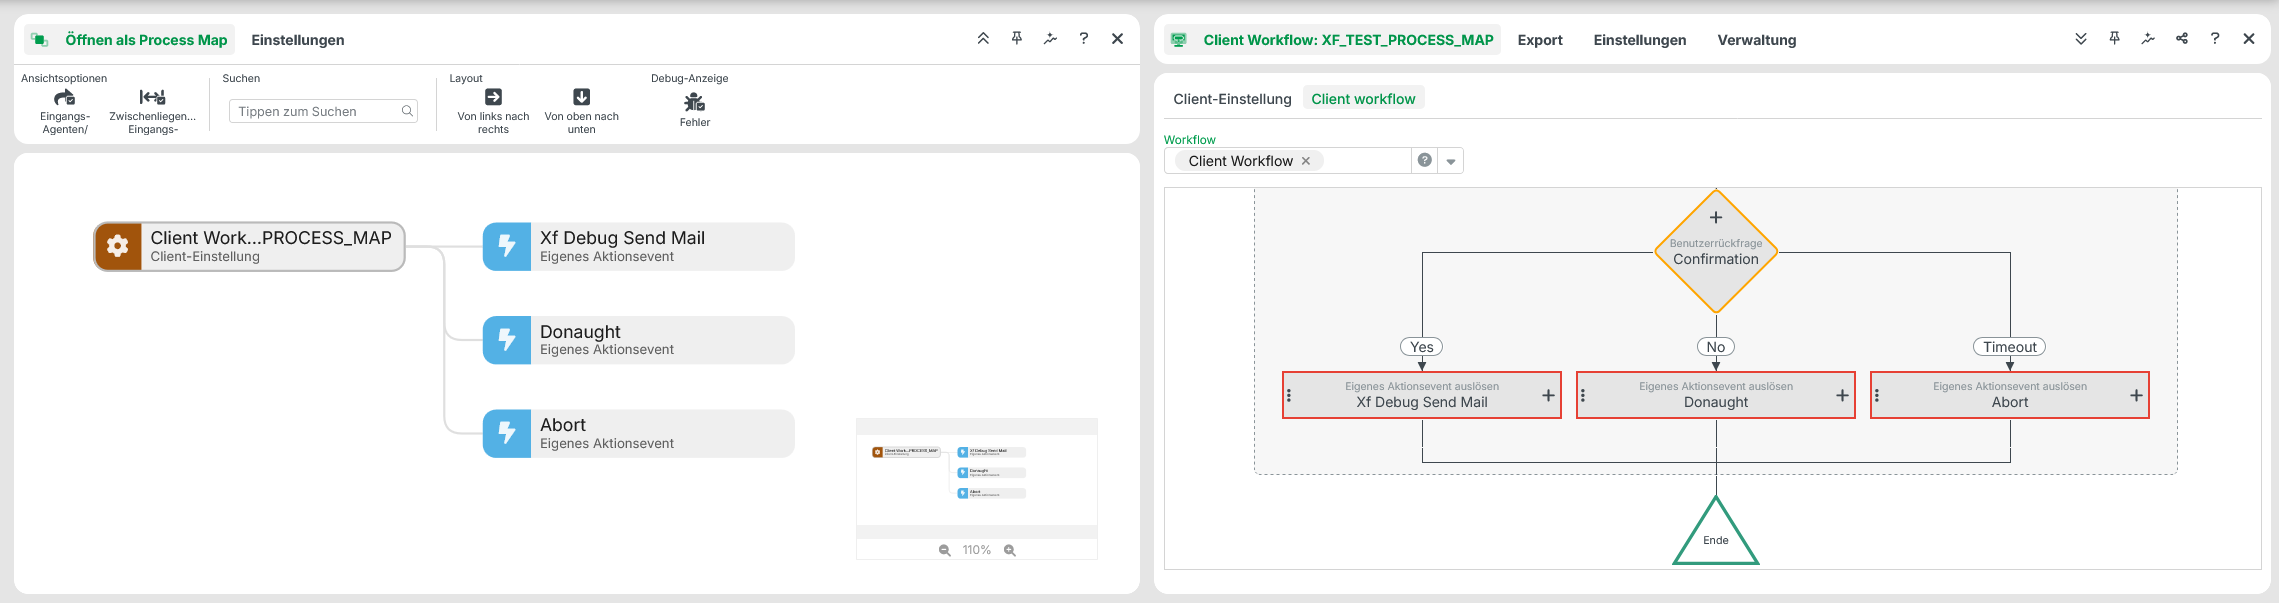
| A client workflow that executes a User callback to run a specific Custom action event depending on its case distinction (Yes/No/Timeout). The "Process map" visualizes the three Triggering events that the client workflow can trigger. | |
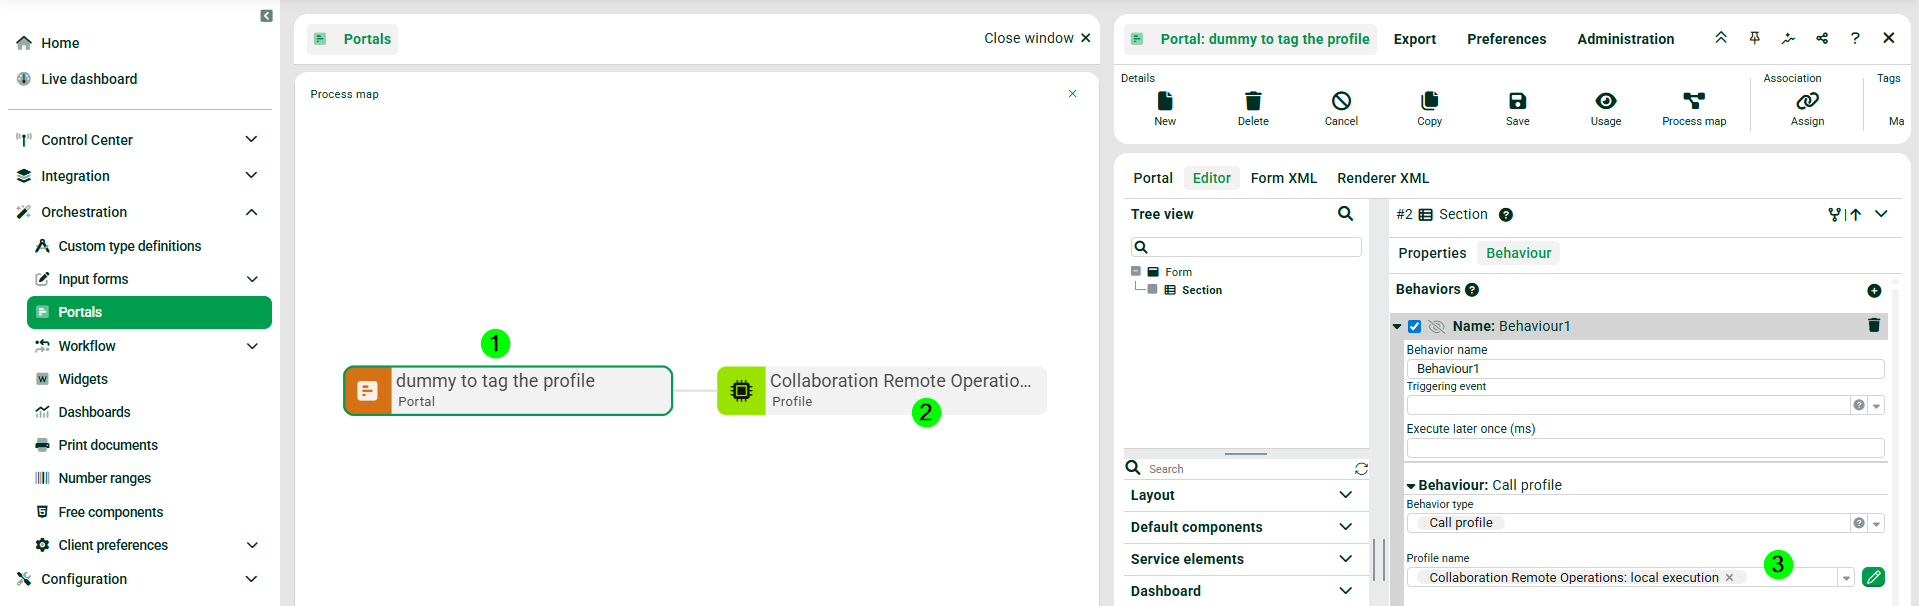
| (1) A portal for which the "Process map" was opened directly under Orchestration > Portals. (2) A Processing profile connected to portal (1), see (3). | |
Input forms | You can also open a "Process map" for an Input form. | NOTE: Calls of views (Open view) from configurations do not appear as nodes in the "Process map". Calls of portals (Open Portal), on the other hand, do appear as nodes. |
Opening elements of the Process Map
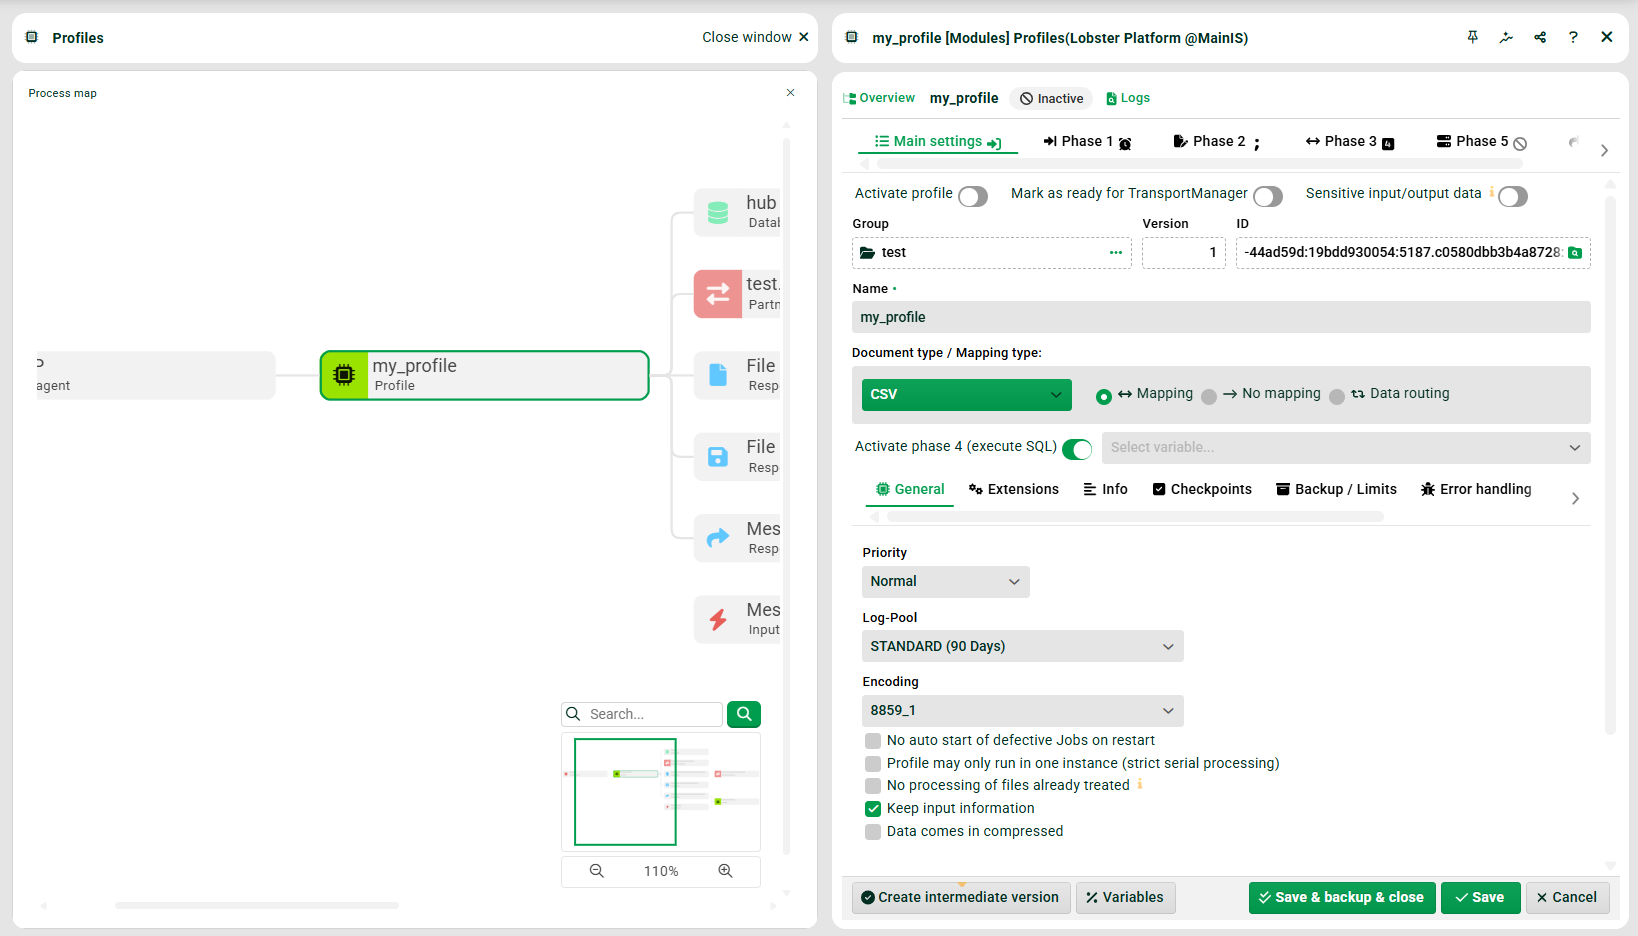
Although the "Process map" itself is not editable, you can open and directly edit certain elements shown in the "Process map". These include, for example, profiles and channels.
In this case, we recommend switching to the side-by-side view.
.png)
Exporting a "Process map"
You can export the "Process map" from the ribbon on the Export tab. The following export formats are available:
Structure:
XML
JSON
Image:
PNG
SVG
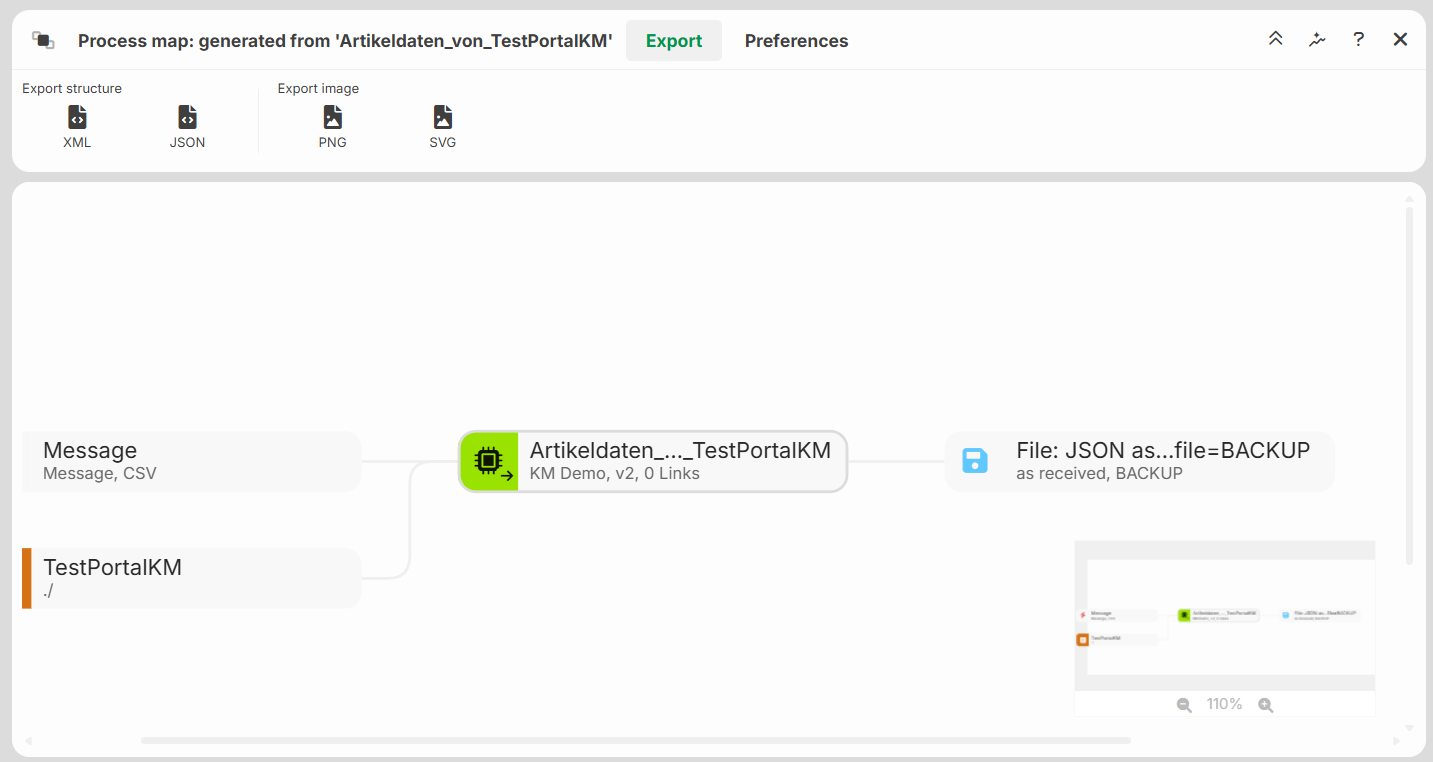
The export reflects any filters you have applied. The zoom level is not carried over – the export is always rendered at 100% zoom.
Clicking an export option downloads the "Process map" in the selected format. Large or complex maps remain readable in the export.
The file name is taken from the "Process map" view title shown in the ribbon (e.g., “Process map: generated from ‘XXX’”).
Nodes and symbols
The "Process map" uses different node types. Each node represents a module from the configuration.
The node types include, among others, profiles, sub-profiles, ETL/ELT entries, CI entries, ASM entries, channels, databases, portals, REST APIs, MCP servers, event handlings, and client workflows. The "Process map" also represents input agents and response routes as nodes.
Long node labels
If a node’s label exceeds the available display width, it is truncated in the middle with an ellipsis …, for example Profile_Lon…ce_001. A tooltip shows the full name when you move the mouse cursor over the node and hold it there.
Information on profile nodes
A profile node shows the mapping type of the profile. The node distinguishes between profile with mapping, profile without mapping, and pure data transfer.
A profile node shows the pre-parsers and integration units used.
Profile and ETL/ELT nodes show an error state. The error state comes from the last execution of the module.
Channels and missing profiles
A channel node shows information about the certificate and its status. If a connected profile is missing or broken, the "Process map" shows a placeholder node. Nodes can carry secondary labels.
Nodes can be expanded and collapsed. This reduces the complexity of the view.
Node states
A node can take on different states. These include: selected, search result, and inactive. When you hover over it with the mouse, the node shows a hover effect.
Controls and filters (Ribbon)
The "Process map" ribbon provides you with functions for controlling the view.
Search
You search for nodes in the "Process map". "The Process map" highlights search results and shows their number. Click the arrow elements and to page through the individual hits. As you page through, the current node is positioned in the center of the "Process map".
Filtering
The view options filter which element types are visible in the "Process map". Each of the two icons toggles between two states. A click activates the desired display mode.
Icon | Name | Function |
|---|---|---|
| Inputs/responses | All input agents and response routes are shown. |
| Inputs/responses | Only "first" entries and "last" responses are displayed. All manual entries are hidden. |
| In-between inputs/responses | In-between input agents and response routes are indicated by an icon on the connection line. |
| In-between inputs/responses | All input agents and responses are hidden. Icons are hidden as well. |




Layout orientation
You can choose the orientation of the layout. The options are Left to right and Top to bottom.
Debug display
In the event of errors, you can show or hide them by clicking the  button in the ribbon. When the checkmark is set, the "Process map" shows an error state on the profile and ETL nodes. The error state comes from the last profile run.
If an error occurred during the last run, a red error icon appears on the node.
If the last run was successful, no icon appears.
This lets you see at a glance which modules in the configuration were last executed with errors.
Mini-map
The Mini-map in the lower right corner of the "Process map" shows a reduced overall view of the diagram. The currently visible section is marked as a frame. By clicking or dragging within the Mini-map, you navigate directly to a different area of the diagram without having to scroll laboriously in the main area.
Separate views
Each "Process map" appears in a separate view. Thus you can conveniently compare several process networks with one another.
Connection-line highlighting
When you select a node, all incoming and outgoing connection lines of that node are highlighted. Connections that are not involved are dimmed. This lets you follow data flows and processing paths at a glance, even in complex "Process maps".